Perform a 2D kernel density estimation using bkde2D and display the
results with contours. This can be useful for dealing with overplotting
geom_bkde2d(mapping = NULL, data = NULL, stat = "bkde2d",
  position = "identity", bandwidth = NULL, range.x = NULL,
  lineend = "butt", contour = TRUE, linejoin = "round",
  linemitre = 1, na.rm = FALSE, show.legend = NA,
  inherit.aes = TRUE, ...)

stat_bkde2d(mapping = NULL, data = NULL, geom = "density2d",
  position = "identity", contour = TRUE, bandwidth = NULL,
  grid_size = c(51, 51), range.x = NULL, truncate = TRUE,
  na.rm = FALSE, show.legend = NA, inherit.aes = TRUE, ...)
Arguments
| mapping | Set of aesthetic mappings created by |
|---|---|
| data | The data to be displayed in this layer. There are three options: If A A |
| stat | The statistical transformation to use on the data for this layer, as a string. |
| position | Position adjustment, either as a string, or the result of a call to a position adjustment function. |
| bandwidth | the kernel bandwidth smoothing parameter. see
|
| range.x | a list containing two vectors, where each vector contains the
minimum and maximum values of x at which to compute the estimate for
each direction. see |
| lineend | Line end style (round, butt, square). |
| contour | If |
| linejoin | Line join style (round, mitre, bevel). |
| linemitre | Line mitre limit (number greater than 1). |
| na.rm | If |
| show.legend | logical. Should this layer be included in the legends?
|
| inherit.aes | If |
| ... | Other arguments passed on to |
| geom | default geom to use with this stat |
| grid_size | vector containing the number of equally spaced points in each
direction over which the density is to be estimated. see
|
| truncate | logical flag: if TRUE, data with x values outside the range
specified by range.x are ignored. see |
Details
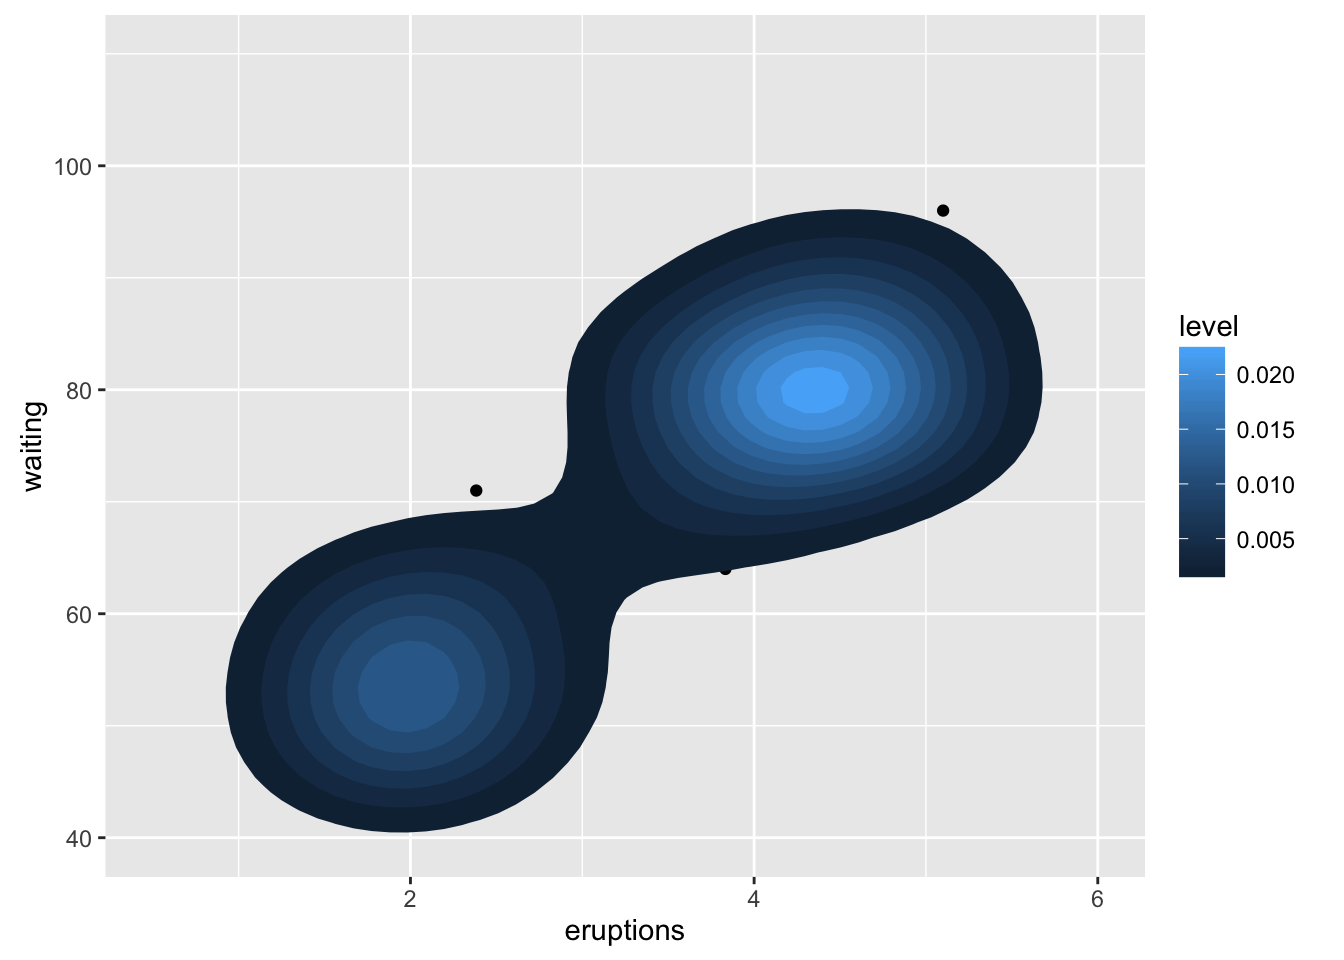
A sample of the output from geom_bkde2d():
Computed variables
Same as stat_contour
See also
geom_contour for contour drawing geom,
stat_sum for another way of dealing with overplotting
Examples
# NOT RUN {
m <- ggplot(faithful, aes(x = eruptions, y = waiting)) +
       geom_point() +
       xlim(0.5, 6) +
       ylim(40, 110)

m + geom_bkde2d(bandwidth=c(0.5, 4))

m + stat_bkde2d(bandwidth=c(0.5, 4), aes(fill = ..level..), geom = "polygon")

# If you map an aesthetic to a categorical variable, you will get a
# set of contours for each value of that variable
set.seed(4393)
dsmall <- diamonds[sample(nrow(diamonds), 1000), ]
d <- ggplot(dsmall, aes(x, y)) +
       geom_bkde2d(bandwidth=c(0.5, 0.5), aes(colour = cut))
d

# If we turn contouring off, we can use use geoms like tiles:
d + stat_bkde2d(bandwidth=c(0.5, 0.5), geom = "raster",
                aes(fill = ..density..), contour = FALSE)

# Or points:
d + stat_bkde2d(bandwidth=c(0.5, 0.5), geom = "point",
                aes(size = ..density..),  contour = FALSE)
# }