Create Chicklet (Rounded Segmented Column) Charts
ggchicklet.RdSometimes it is useful to stylize column charts a bit more than just bland rectangles. Methods are provided to create rounded rectangle segmented column charts (i.e. "chicklets").
Details
c("\nA sample of the output from geom_chicklet():", "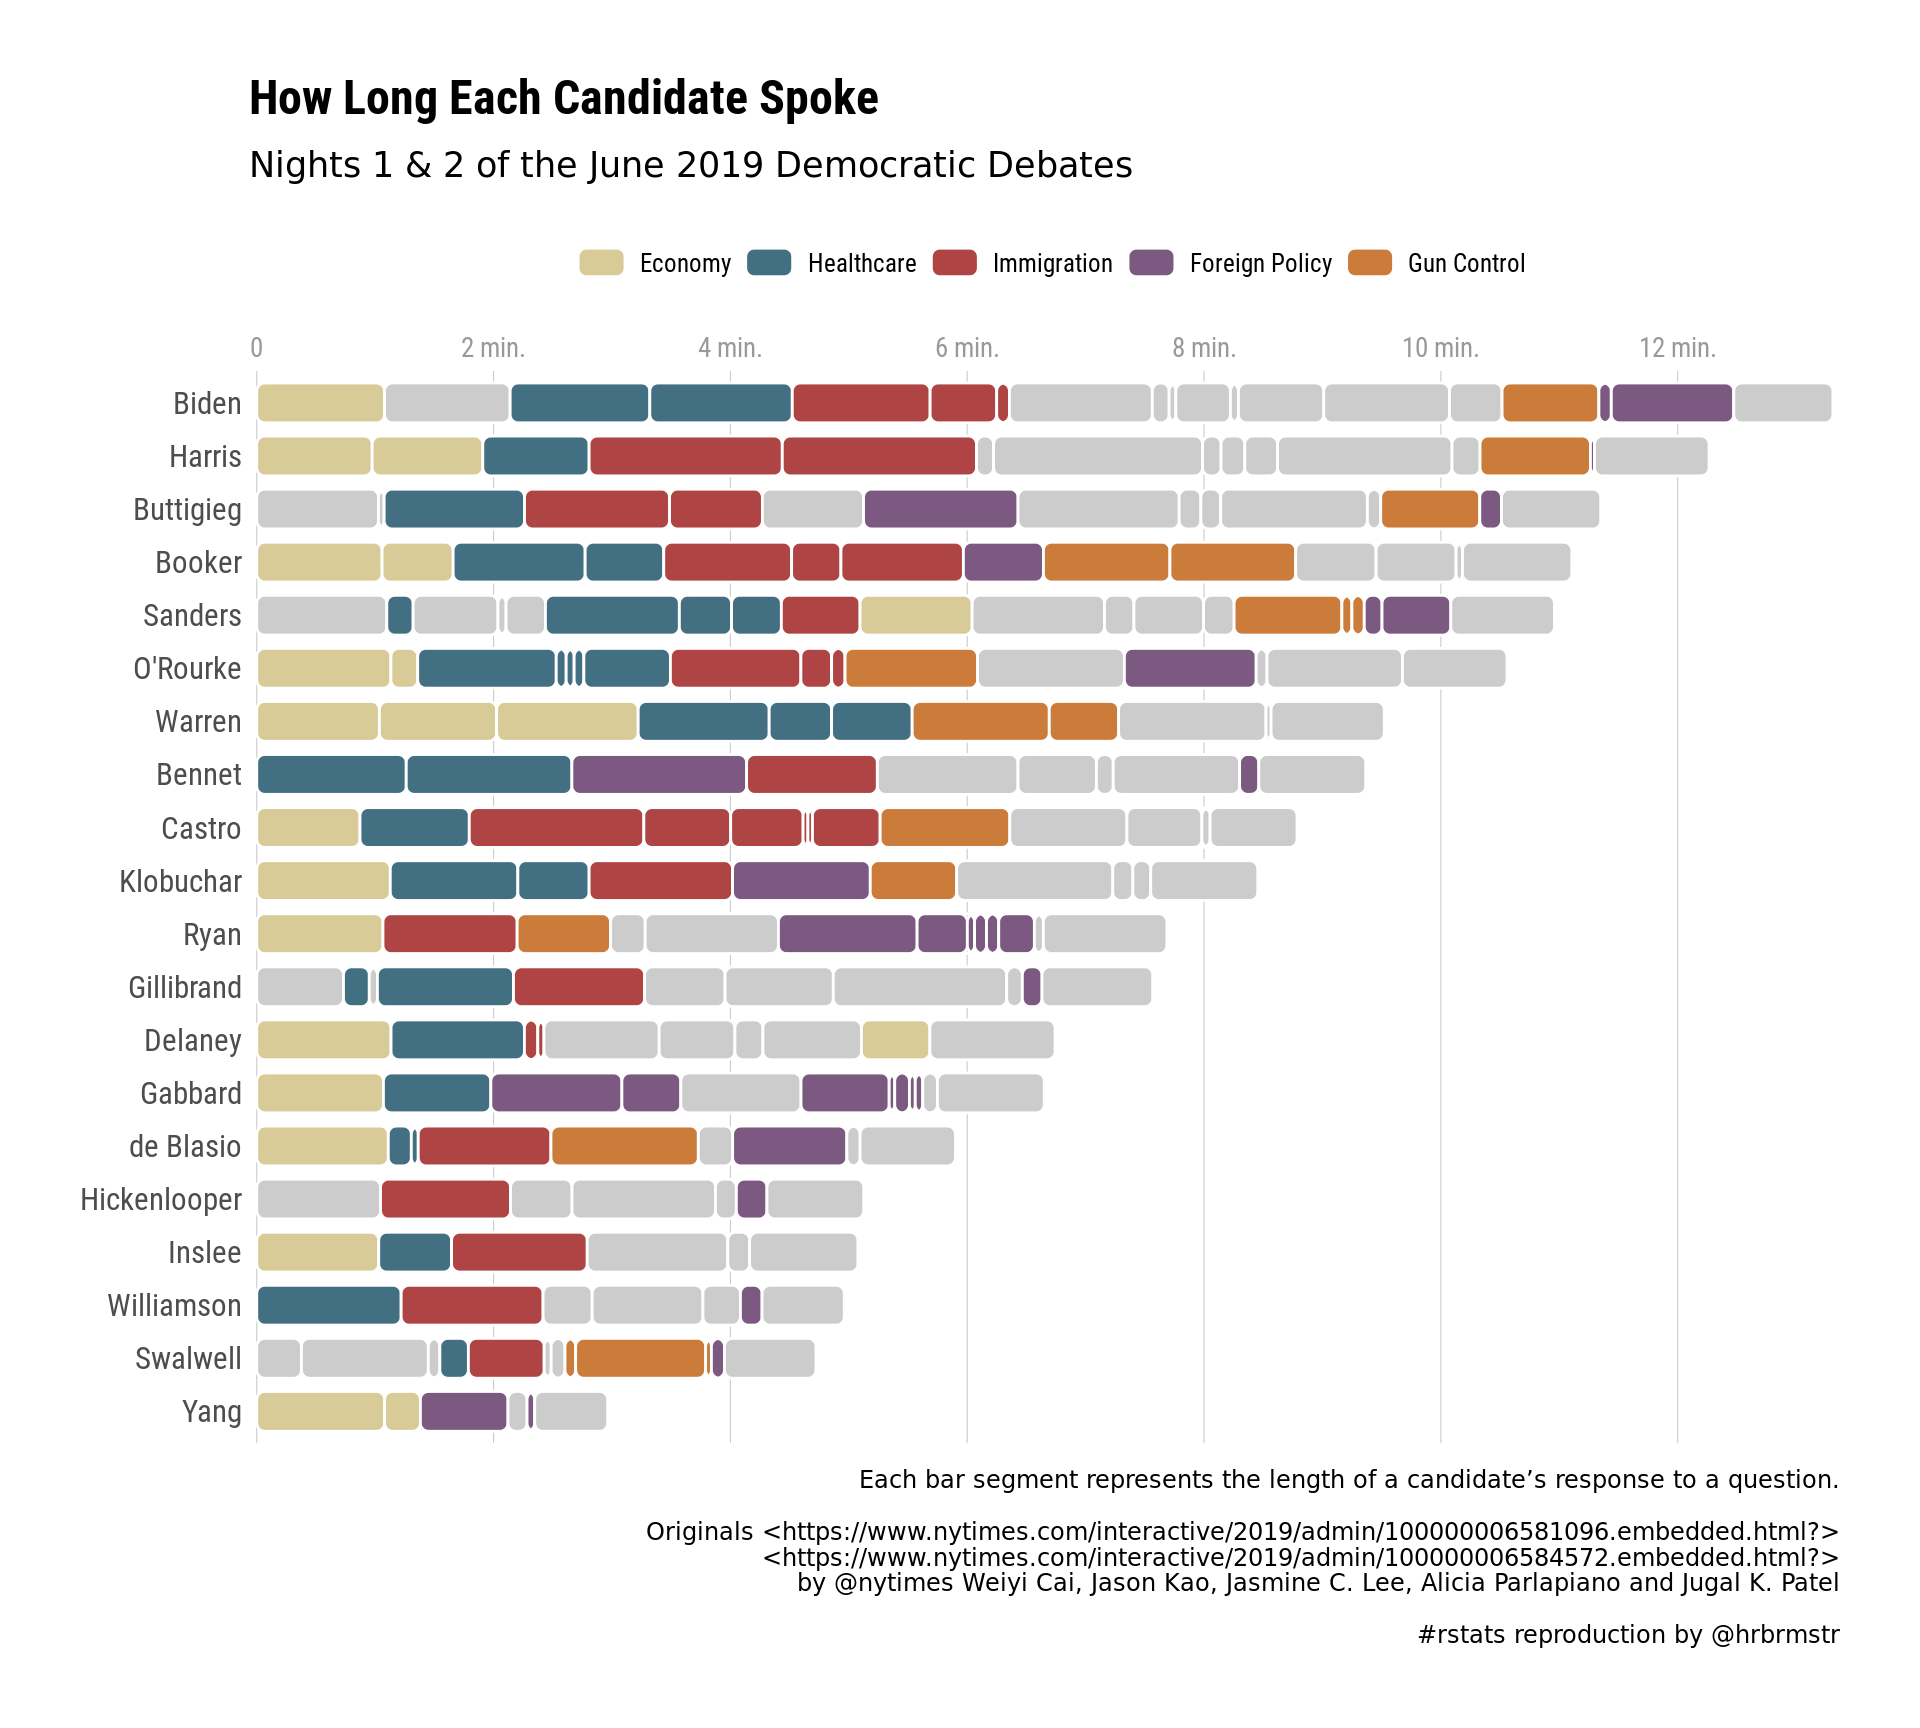 \n")
\n")
character(0)
See also
Useful links: