World Tile Grid Geom
geom_wtg.RdPass in a data frame of countries (iso2c, i23c, name) and a value column and get back a world tile grid. You don't need to have all countries in your original data set, but this is a world tile grid and only having a few countries may not make sense for the message you're trying to convey.
geom_wtg(mapping = NULL, data = NULL, border_col = "white",
  border_size = 0.125, na.rm = TRUE, show.legend = NA,
  inherit.aes = TRUE, ...)

GeomWtg

stat_wtg(mapping = NULL, data = NULL, na.rm = NA, show.legend = NA,
  inherit.aes = TRUE, ...)

StatWtg
Arguments
| mapping | Set of aesthetic mappings created by |
|---|---|
| data | The data to be displayed in this layer. There are three options: If A A |
| border_col | border color of the country squares, default " |
| border_size | thickness of the square country borders |
| na.rm | If |
| show.legend | logical. Should this layer be included in the legends?
|
| inherit.aes | If |
| ... | other arguments passed on to |
Format
An object of class GeomWtg (inherits from Geom, ggproto, gg) of length 7.
Details
Labeling world tile grids is a tricksy business and no labeling
parameters are planned for this since you should think very carefully about
the tradeoffs of tiny text/numbers vs readability. These charts are really
only good for overviews in single-chart form or highlighting stark differences
in panel-form. See the section on Computed variables for data that is
available to be used as labels.
There are two special/critical aes() mappings:
country(so the geom knows which column to map the country names/abbrevs to)fill(which column you're mapping the filling for the squares with)
Output sample
c("\nA sample of the output from geom_wtg():", "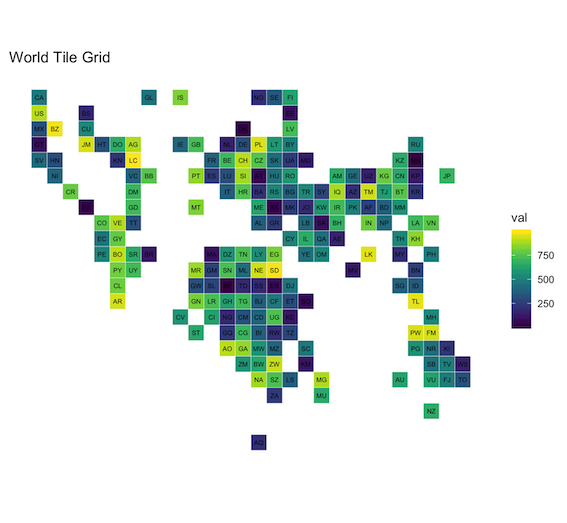 \n")
\n")
character(0)
Computed variables
x,y: the X,Y position of the tilename: Country name (e.g.Afghanistan)country.code: ISO2C country code abbreviation (e.g.AF)iso_3166.2: Full ISO 3166 2-letter abbreviation code (e.g.ISO 3166-2:AF)region: Region name (e.g.Asia)sub.region: Sub-region name (e.g.Southern Asia)region.code: Region code (e.g.142)sub.region.code: Sub-region code (e.g.034)
Examples
# NOT RUN {
library(ggplot2)
library(worldtilegrid)
set.seed(1)
data.frame(
  ctry = worldtilegrid::wtg$alpha.3,
  val = sample(1000, length(worldtilegrid::wtg$alpha.3)),
  stringsAsFactors = FALSE
) -> xdf

ggplot(xdf, aes(country = ctry, fill = val)) +
  geom_wtg() +
  geom_text(aes(label = stat(alpha.2)), stat="wtg", size=2) + # re-compute the stat to label
  coord_equal() +
  viridis::scale_fill_viridis(direction = -1) +
  labs(title = "World Tile Grid") +
  theme_minimal() +
  theme_enhance_wtg()
# }